Information on Data tables and Bar Graphs. Click on the pictures to see them bigger:

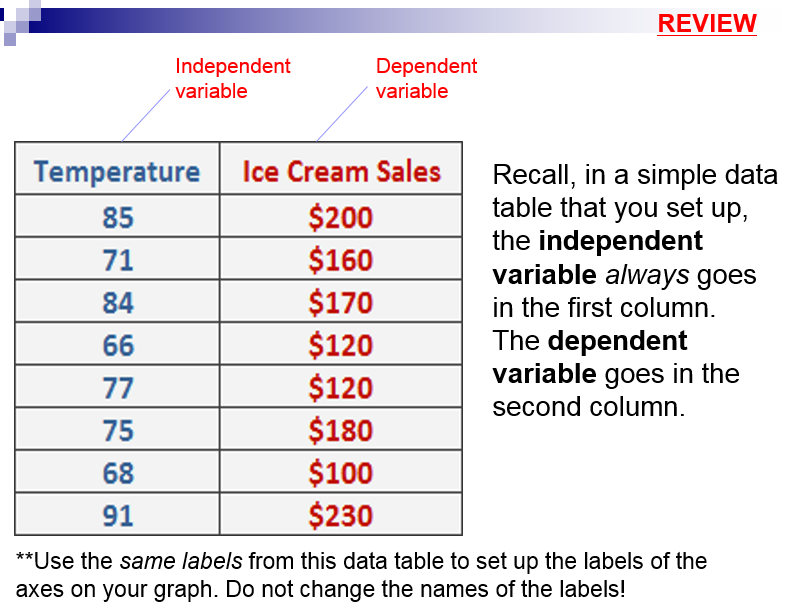


These are ways to remember where to put each variable on the x- and y- axis, in case you forget:


- Remember to start with a 0 on the scale.
- In order to determine which scale to use, first find the range by taking the largest number in your data table and then subtracting it by the smallest number (ex: 68-22 = 46)
After you find the range, divide it by the number of boxes on the y-axis. Whatever decimal number you get, round it up to the nearest whole number and that is your scale (ex- 1.3 --> 2)
* Here is a link to show more information on bar graphs--> Bar Graph Info
